Cistrome-GO: a webserver for functional enrichment analysis of transcription factor ChIP-seq peaks
Overview
Uncovering the direct target genes of transcription factors (TFs) and annotating their functions is important for understanding TFs’ biological roles. Chromatin immunoprecipitation plus DNA sequencing (ChIP-seq) is a broadly used technique of identifying TF binding sites genome-wide. To identify the genes that are directly regulated by the TF, we developed a web-server, called Cistrome-GO, which allows users to input ChIP-seq peaks and outputs gene scores for indicating the regulatory potential of the TF by weighting the contribution of gene surrounding peaks. Importantly, Cistrome-GO performs gene ontology analysis and pathway enrichment further using the calculated genome-wide scores. Differential expression analysis between TF perturbations (i.e. stimulation, repression, knock-down or knockout) and controls is an alternative approach for predicting TF targets. However, it is difficult to determine whether the differentially expressed genes in such experiments are direct targets of the TF using expression profile only. Therefore, ChIP-seq peaks adding differential expression information upon TF perturbation could be used to discriminate between directly regulated genes and secondary effects more accurately.
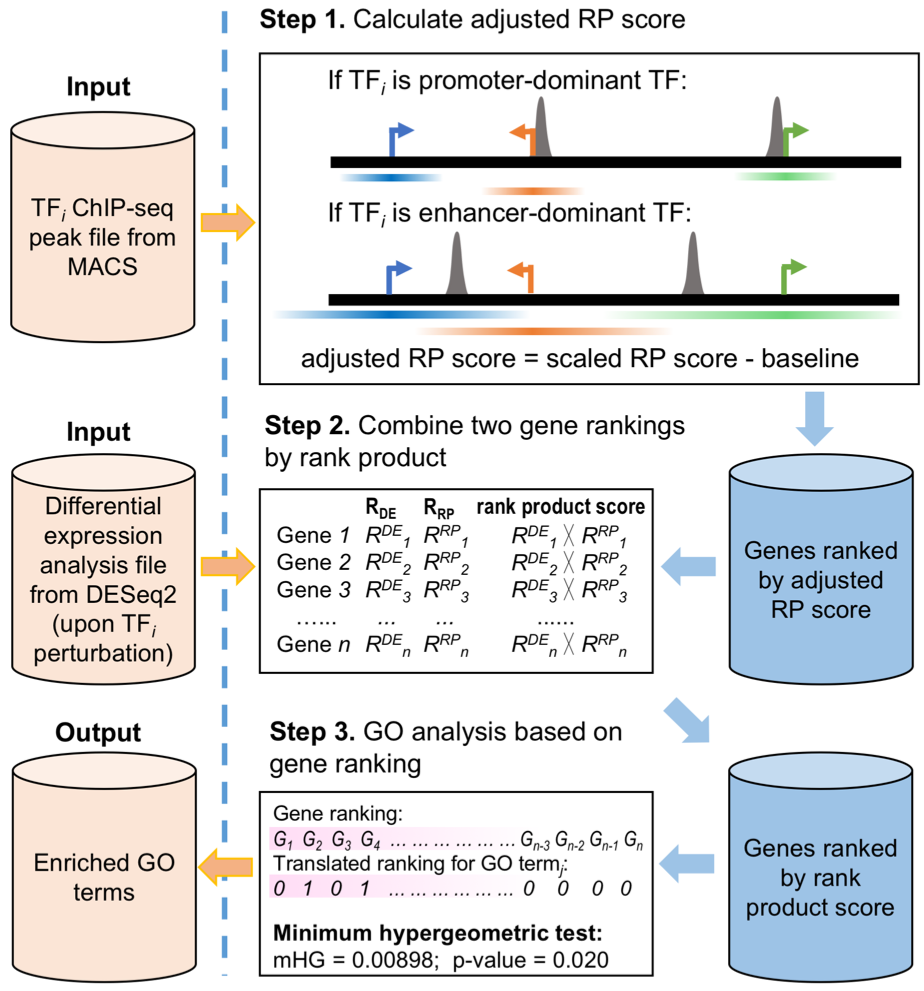
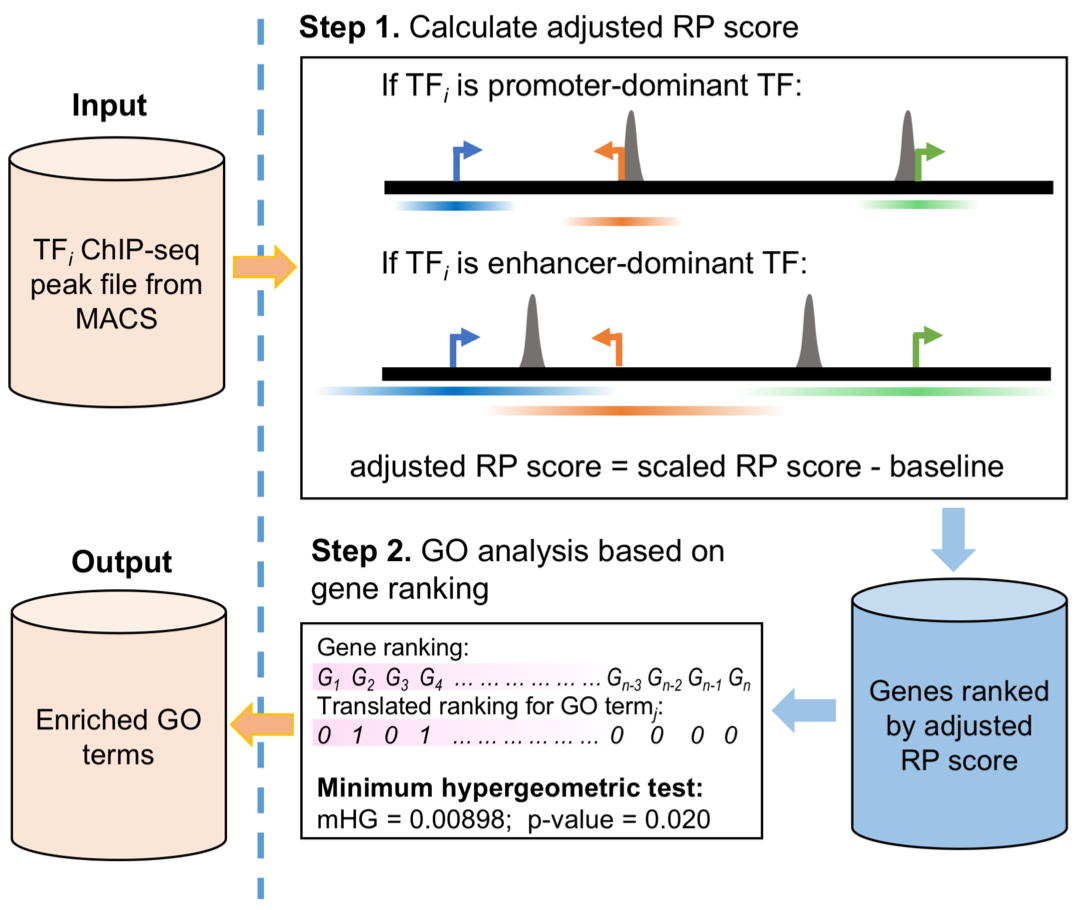
Cistrome-GO provides two working modes for functional enrichment analysis of genes regulated by TFs in human and mouse.. (1) If a ChIP-seq peak file and a differential expression analysis file (upon the TF’s perturbation) are provided, Cistrome-GO will perform an ensemble mode analysis based on the integration of the two types of data (Figure 1).(2) If only a TF ChIP-seq peak file is provided, Cistrome-GO will perform the analysis in solo mode (Figure 2) to assign the regulatory potential scores genome-widely. The details of two modes are introduced below.
Method summary
1. Classification of TF as promoter-dominant or enhancer-dominant type
A TF can regulate the expression of its targets by binding cis-regulatory elements, including promoters and enhancers. For some TFs, such as MYC, many binding sites are close to (< 1 kb) transcription start sites (TSS). Such TFs are of the promoter-dominant type. On the other hand, the binding sites for TFs such as AR and ESR1 tend to be less enriched in promoters but intergenic regions. These TFs are of the enhancer-dominant type.
When the user uploads a TF’s ChIP-seq peak file, Cistrome-GO calculates the percentages of the most significant ChIP-seq peaks (top 2000, 5000, 10000 and all peaks separately, if applicable; ranked by -log10p-value) within 1kb of the TSS. If any of the calculated percentages are larger than 20%, the TF will be classified as promoter-dominant type. Otherwise, it will be classified as enhancer-dominant type. In Cistrome-GO, promoter-dominant type and enhancer-dominant type TFs have different parameters to calculate the regulatory potential score (RP score).
2. Calculation of RP score
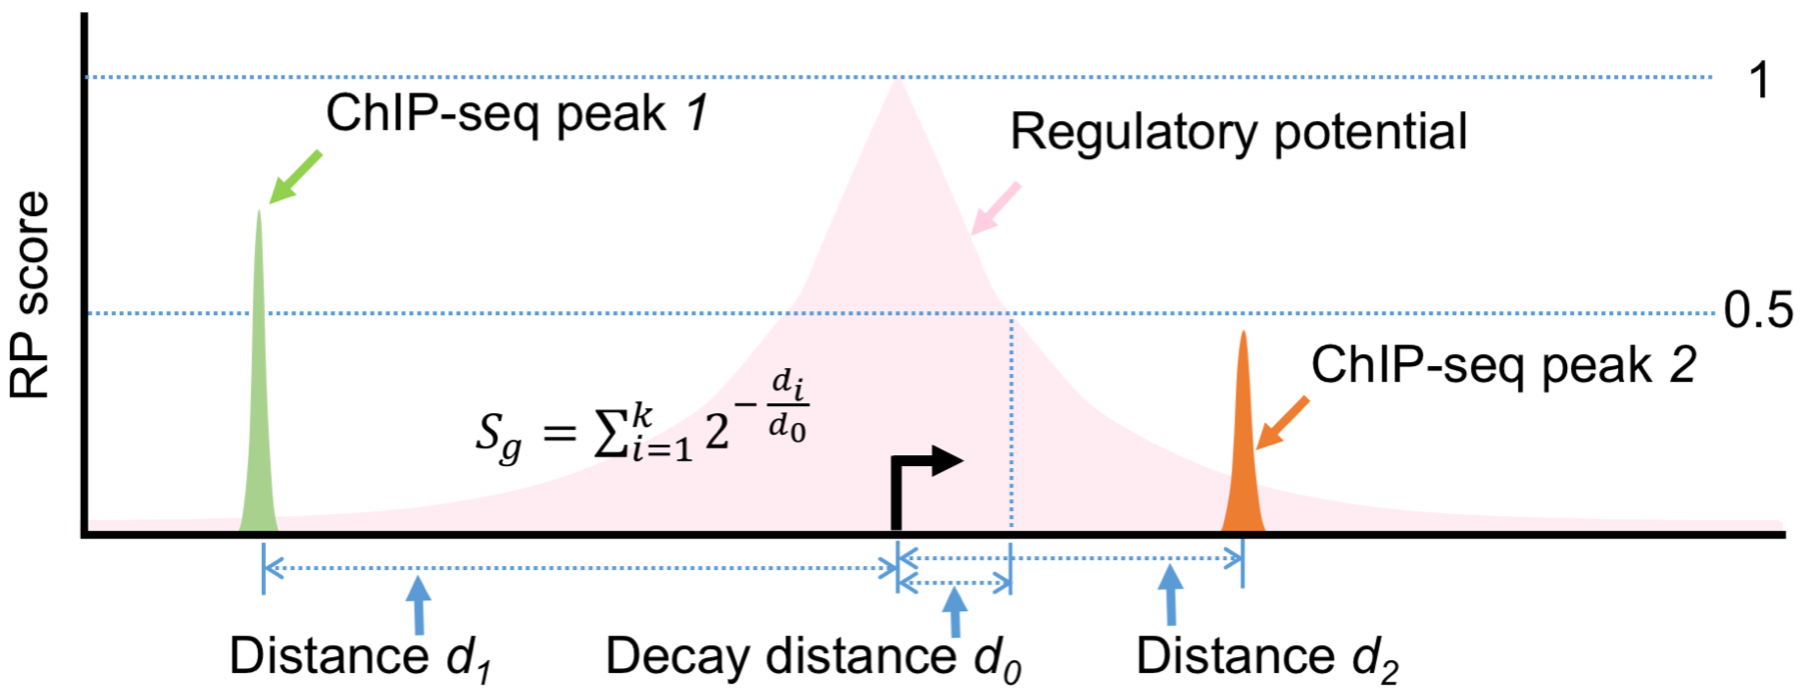
The regulatory potential score (RP score) of a gene is its likelihood of being regulated by a TF (Wang et al, Nature Protocols 2013). In Cistrome-GO, the formula of RP score calculation is shown in (Figure 3).
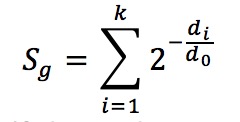
The parameter d0 is the half-decay distance, with default value 1 kb for promoter-type TFs and 10 kb for enhancer-type TFs. (Users can also specify the parameter to other values in the advanced settings). All k binding sites near the TSS of gene g (within the distance 15 * d0) will be used in the calculation, and di is the distance between the ith peak’s center and TSS.
For a given input ChIP-seq peak file, an RP score is calculated for each gene. The gene rank RRP is derived by decreasing RP score.
3. RP score adjustment
By studying RP scores from 8470 human and 6243 mouse TF ChIP-seq samples, we noticed that some genes always have high RP score across different samples, and this gene set is significantly enriched in some biological process terms. Therefore, we decide to adjust the RP score from user’s data by considering the background from batch existing ChIP-seqs (8470 human, 6243 mouse ChIP-seq samples) to get the more accurate and specific function of the TF.
4. Integration with differential expression data by rank product
If the user provides a differential expression analysis file in addition to a ChIP-seq peak file, an additional gene rank RDE is derived based on the increasing of P-value/adjusted P-value/FDR. In the ensemble mode of Cistrome-GO, the two ranks (RRP and RDE) are integrated by rank product. For example, if genei’s ranks are RRPi and RDEi respectively, its rank product score is RRPi * RDEi. The integrated gene rank is derived from the rank product score. The genes at the top of the list tend to have higher RP scores, together with more significant expression changes upon the TF’s perturbation. Therefore, they are more likely to be true direct targets of the TF. Users can opt to analyze up-regulated genes, down-regulated genes, or all genes in the differential expression analysis file.
5. GO and KEGG enrichment analysis based on gene ranking
In the Cistrome-GO ensemble mode, the gene rank is based on the rank product score of integrating ChIP-seq and expression data. In the solo mode, the gene rank is based on the RP score from ChIP-seq peaks. In both modes, the top-ranked genes are most likely to be directly regulated by the TF, in principle, the ensemble mode with the help of differential expression data should perform better than solo mode which has ChIP-seq only In order to determine the Gene Ontology (GO) terms and KEGG pathways that are significantly enriched in the genes at the top of the list in a threshold-free way, Cistrome-GO applies the minimum hypergeometric (mHG) test on the ranked gene list for each GO terms and pathways. An enrichment score, p-value, and an FDR are calculated for each GO term or pathway.
Input files
1. ChIP-seq peak file (required)
The input ChIP-seq peak file is a tab-separated plain-text file in Browser Extensible Data (BED) format. This type of file could be generated from our MACS2 ChIP-seq analysis software. The BED format plain-text file has at least the following 5 tab-separated columns.
- chromosome
- chromStart
- chromEnd
- name
- score
The 5th column is the peak score, with larger numbers representing more confident peak calls, and is used by Cistrome-GO to rank the peaks. In MACS2 the score can be the -log10(p-value)/-log10(q-value)/fold_enrichment. Click here for an example peak file.
2. Differential expression analysis file (optional)
An optional differential expression (DE) analysis input file can augment the ChIP-seq information. This file contains the results of a DE analysis of the transcriptional response to perturbation of the TF of interest. The output file of the DESeq2 RNA-seq analysis can be uploaded as the input differential expression analysis file directly. This is a plain text file tab delimited with the following 7 tab-separated columns. Click here for an example file of DESeq2.
- geneName
- baseMean
- log2FoldChange
- log fold change Standard Error
- statistic
- p-value
- adj-p-value
For the 1st column (geneName), Cistrome-GO supports official gene symbols, RefSeq, and Ensembl IDs. The 7th column (adj-p-value) is used in Cistrome-GO to rank genes. The 3rd column (log2FoldChange) is used to distinguish between up-regulated and down-regulated genes. Also, Cistrome-GO supports differential expression file from limma and Cuffdiff. Click here for an example file of limma. Click here for an example file of Cuffdiff. If you have a tab-delimited differential expression file from other software or a customized program, you can set up the column index of geneID, logFoldChange, p-value/FDR.
Parameters
1. Species
Cistrome-GO supports two species (human and mouse) and two genome assembly versions for each species (hg38 and hg19 for human; mm10 and mm9 for mouse).
2. Genes for enrichment analysis
The users can choose to only consider up-regulated or down-regulated genes in the differential expression analysis file into the Cistrome-GO analysis. The default is to consider all genes in the differential expression analysis file. This parameter will be active after you select a differential expression file.
3. Analysis title
You can set an analysis title for your Cistrome-GO analysis especially when you have several runs. This analysis title can become the title of the result page which can help you better distinguish from a different run.
4. Peak number to use
The number of the most significant ChIP-seq peaks used to calculate the RP score. The peaks are ranked based on decreasing of score column (-log10(p-value)/-log10(q-value)/fold_enrichment). The default value is 10,000. The user can set this parameter by an integer(eg. 20000) for top peaks number to use, decimals less than 1(eg. 0.5) for top proportion of peaks to use, percentage less than 1(eg. 50%) for top percentage of peaks to use, or the characters all, which means using all peaks.
5. Customized half-decay distance (kb)
In Cistrome-GO, the promoter-dominant and enhancer-dominant TF types use different decay distances d0 in the calculation of the RP score (1 kb for the promoter-dominant type and 10kb for the enhancer-dominant type by default). The user can also select a half-decay distance.
6. Expression file format
The users can indicate the format of the differential expression analysis file. The default format is DESeq2 output format (with the 1st column for gene ID, the 3rd column for logFoldChange and the 7th column for FDR used in Cistrome-GO). If you select Other type, you can set up the Column index of (GeneID, logFoldChange, FDR) of your customized differential expression file below. This box will be active after you select a differential expression file.
7. Cutoffs of (logFoldChange, FDR) for DE genes:
In order to draw the plot of the association between differential expression and peaks, we need to define significantly differentially expressed genes with absolute log2FoldChange larger than logFoldChange cutoff and FDR less than FDR cutoff. By default, the absolute logFoldChange cutoff is 1.0, FDR cutoff is 0.05.
8. FDR cutoff of GO/KEGG terms to return:
Here we set a cutoff of FDR to control the number of enriched GO/KEGG terms to return. By default is 0.2. Enriched GO/KEGG with FDR less than the FDR cutoff will be returned in the result page.
9. Minimum and maximum gene number in GO and KEGG gene sets:
Users can set this parameter to control the number of genes in the gene set used to do enrichment analysis. By default each gene set should contain at least 10 genes and at most 2000 genes.
Output
1. Summary page
The parameters you set to run Cistrome_GO.
2. Bar plot of percentage of top peaks at promoter regions
To determine whether the regulatory type of the TF is promoter-dominant or enhancer-dominant the percentage of binding with 1kb of gene TSSs is determined (1kb between peak center and TSS). This is shown in a bar-plot of percentages for the top peaks (top 2000, 5000, 10000 and all peaks separately, if applicable; ranked by -log10p-value). If any of the percentages is larger than 20%, the TF is classified as promoter-dominant. Otherwise, it is classified as enhancer-dominant. For the promoter-dominant TFs, a decay distance of 1kb is used in the RP score calculation; 10kb is used for the enhancer-dominant TFs.
3. ROC and PRC of the association between differential expression and peaks (only for ensemble mode)
Firstly, we separate genes in the differential expression list into up-regulated genes and down-regulated genes using logFoldChange. Then using user determined logFoldChange cutoff and FDR cutoff to get significantly differentially expressed genes and regard them as the true positive. We use RP score to predict whether a gene is significantly differentially expressed. Thus, we can get the receiver operating characteristic(ROC) curve and precision-recall(PR) curve and calculate their AUC. The plot can help determine the activating or repressing function of the TF.
4. Table of gene regulatory potential rank
For the solo mode of Cistrome-GO, the output table contains the following 7 columns.
- Gene: official gene symbol
- Coordinate: the coordinate of the gene in the genome
- Visualization: the external links for visualizing the gene and ChIP-seq peak file in WashU Epigenome Browser and UCSC Genome Browser
- Peak number: peak numbers used to calculate the RP score of the gene.
- RP score: the calculated regulatory potential score
- adjusted RP score: normalize the original RP score using min-max normalization and subtract background RP score
- Ranked by adjusted RP score: the rank of genes based on the decreasing of adjusted RPscores
For the ensemble mode of Cistrome-GO, the output table contains the following 9 columns.
- Gene: official gene symbol
- Coordinate: the coordinate of the gene in the genome
- Visualization: the external links for visualizing the gene and ChIP-seq peak file in WashU Epigenome Browser and UCSC Genome Browser
- Peak number: peak numbers used to calculate the RP score of the gene.
- RP score: the calculated regulatory potential score
- adjusted RP score: normalize the original RP score using min-max normalization and subtract background RP score
- logFoldChange: the logFoldChange of the gene from the input differential expression analysis file (upon the TF’s perturbation)
- DE significance: the p-value/FDR of the gene from the input differential expression analysis file (upon the TF’s perturbation)
- Ranked by rank product: the rank of genes based on the increase of rank product scores
5. Tables of GO terms or KEGG pathway enrichment
The GO terms or KEGG pathway output contain 4 tables, for KEGG pathways, CC (Cellular Components), MF (Molecular Functions) and BP (Biological Processes) separately. The terms with FDRs smaller than user determined cutoff (by default is 0.2) are reported. Each table contains the following 5 columns.
- GO terms or KEGG pathways: the name and external link for each enriched GO terms or KEGG pathways
- Enrichment: the enrichment is defined as (b/n)/(B/N). N: the total number of genes; B: the total number of genes in the considered GO term / KEGG pathway; n: the cutoff of top genes used to get the mHG p-value; b: the number of genes among the top n genes in the considered GO term / KEGG pathway
- P-value: the mHG p-value
- FDR: Benjamini-Hochberg adjusted p-value
- Genes: Gene number of the GO term; Click the number to check RP scores of genes in the GO term / KEGG pathway
Implementation
A detailed description of implementation: Cistrome-GO server implementation can be separated into two parts, back-end, and front-end (interface). The tasks of back-end can be summarized on calculating RP score, doing GO/KEGG enrichment analysis, and sending the result out using API. Django framework was used to build the back-end of Cistrome-GO server. For the front-end, HTML and javascript are the main languages. By this design, Cistrome-GO server is able to delivery uploaded data from Django and display the results on the browser. To prevent the hacker attack, we are afraid that we cannot release the code including the whole implementation of Cistrome-GO. Instead, we are happy to make the Cistrome-GO back-end code public at Liu lab bitbucket.
Browser Compatibility
| OS | Version | Chrome | Firefox | Safari | Microsoft Edge |
|---|---|---|---|---|---|
| MacOS | 10.11.6 | 71.0.3578.98 | 64.0 | 10.1.2 | n/a |
| Linux | ubuntu 18.04.1 LTS | 71.0.3578.98 | 61.0.1 | n/a | n/a |
| Windows | 10 | 72.0.3610.2 | 64.0 | n/a | 44.177763.1.0 |
FAQ
1. Which genome assemblies can be used by Cistrome-GO?
Currently, Cistrome-GO supports two species (human and mouse) and two genome assembly versions for each species (hg38 and hg19 for human; mm10 and mm9 for mouse). The user can use liftOver function of UCSC Genome Browser to convert ChIP-seq peak file from other genome assembly version to the version supported by Cistrome-GO.
2. Can Cistrome-GO use a ChIP-seq peak file not generated by MACS2?
The input ChIP-seq peak file of Cistrome-GO must be a tab-separated BED format plain-text file, with at least 5 columns. The 5th column is used in Cistrome-GO to rank peaks by the decreasing of the value. The user can use a custom script to convert the ChIP-seq peak file to the required format.
3. Can Cistrome-GO be used to analyze a differential expression analysis file based on other types of gene ID (such as Entrez, UniGene, etc)?
Cistrome-GO supports official gene symbol, RefSeq ID, and Ensembl ID. The user can use DAVID gene ID conversion tool to convert the other types of gene ID to one of the above three types.
4. If the user has a differential expression analysis file not generated by DESeq2, how to use Cistrome-GO?
Cistrome-GO also supports a plain-text differential expression analysis file with three columns: 1) geneName, 2) log FoldChange, 3) p-value/FDR. The user can use a custom script to convert the differential expression analysis file to the three-column format.
5. When does the user choose the ensemble mode (integration of ChIP-seq and differential expression) of Cistrome-GO?
The user can use the ensemble mode of Cistrome-GO, when the user has expression data before and after perturbing the TF’s level (such as overexpression, knock-down or knock-out), and the TF’s ChIP-seq data is generated in one of the above two conditions.
6. How are target genes assigned in Cistrome-GO?
Cistrome-GO does not provide a list of genes as a TF’s targets. Instead, it returns a gene rank. In the ensemble mode of Cistrome-GO, the gene rank is based on the increasing of rank product score. In the solo mode, the gene rank is based on the decreasing of RP score. In both modes, genes in the top of the list are more likely to be directly regulated by the TF.
7. How many concurrent users can use it, will it scale up?
The maximum task number is 8 in parallel because the server now uses 8 cores to run Cistrome-GO. If we notice more users after publication, we can assign more cores.
8. How long will the result page be kept?
You can bookmark the result page. We will keep it for a month.
9. Do you support other gene sets such as immunologic gene sets from MSigDB?
Since we have no idea what gene sets people really need and there can be too many gene sets available, we can only set up a basic version of gene sets now. If you have any recommended gene sets, feel free to email us. We can add gene sets people really need in the near future.
10. How to cite Cistrome-GO?
Li S, Wan C, Zheng R, et al. Cistrome-GO: a web server for functional enrichment analysis of transcription factor ChIP-seq peaks[J]. Nucleic acids research, 2019.